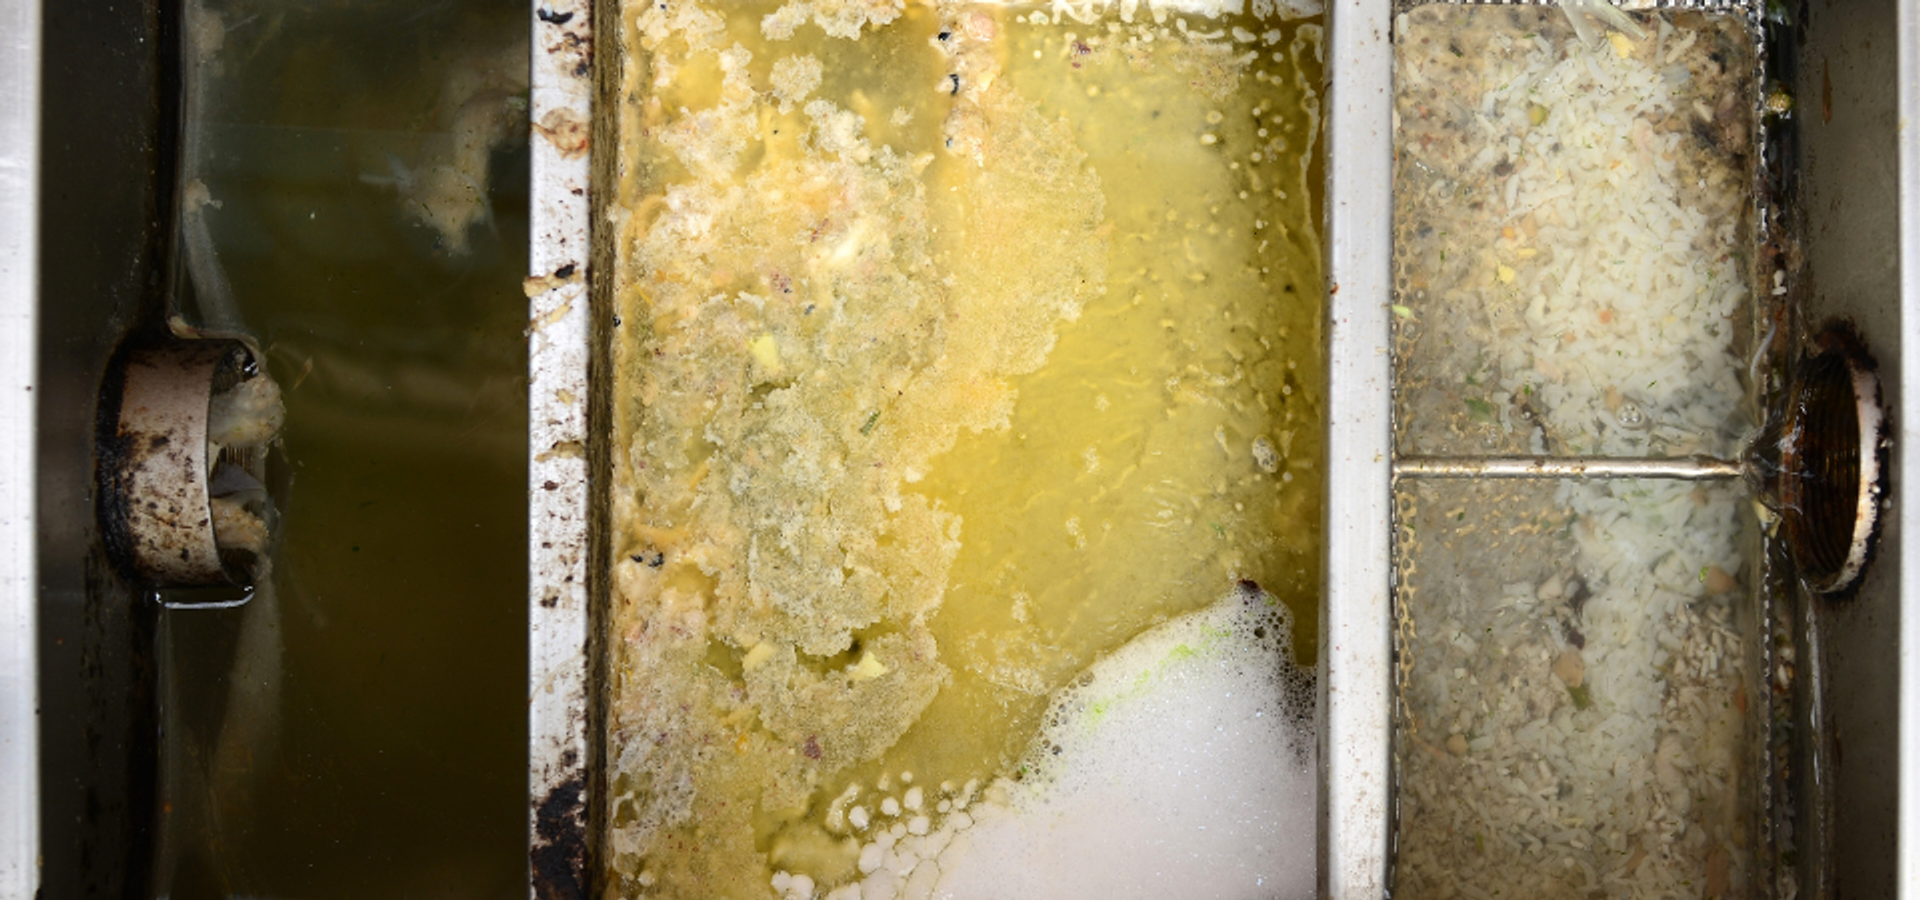
Nearly every commercial kitchen is required to operate and maintain a grease trap that prevents clogged pipes and blockages. Grease traps work by intercepting fats, oils, and grease (FOGs) in wastewater before they can enter the drain and subsequently the main sewer. FOGs are produced during cooking, baking, frying, dishwashing, and many other culinary operations.
When wastewater enters a grease trap, it separates into solids on the bottom, wastewater in the middle, and FOGs on the top. FOGs and water do not mix because fats and oils are less dense than water, so they float to the top of the wastewater.
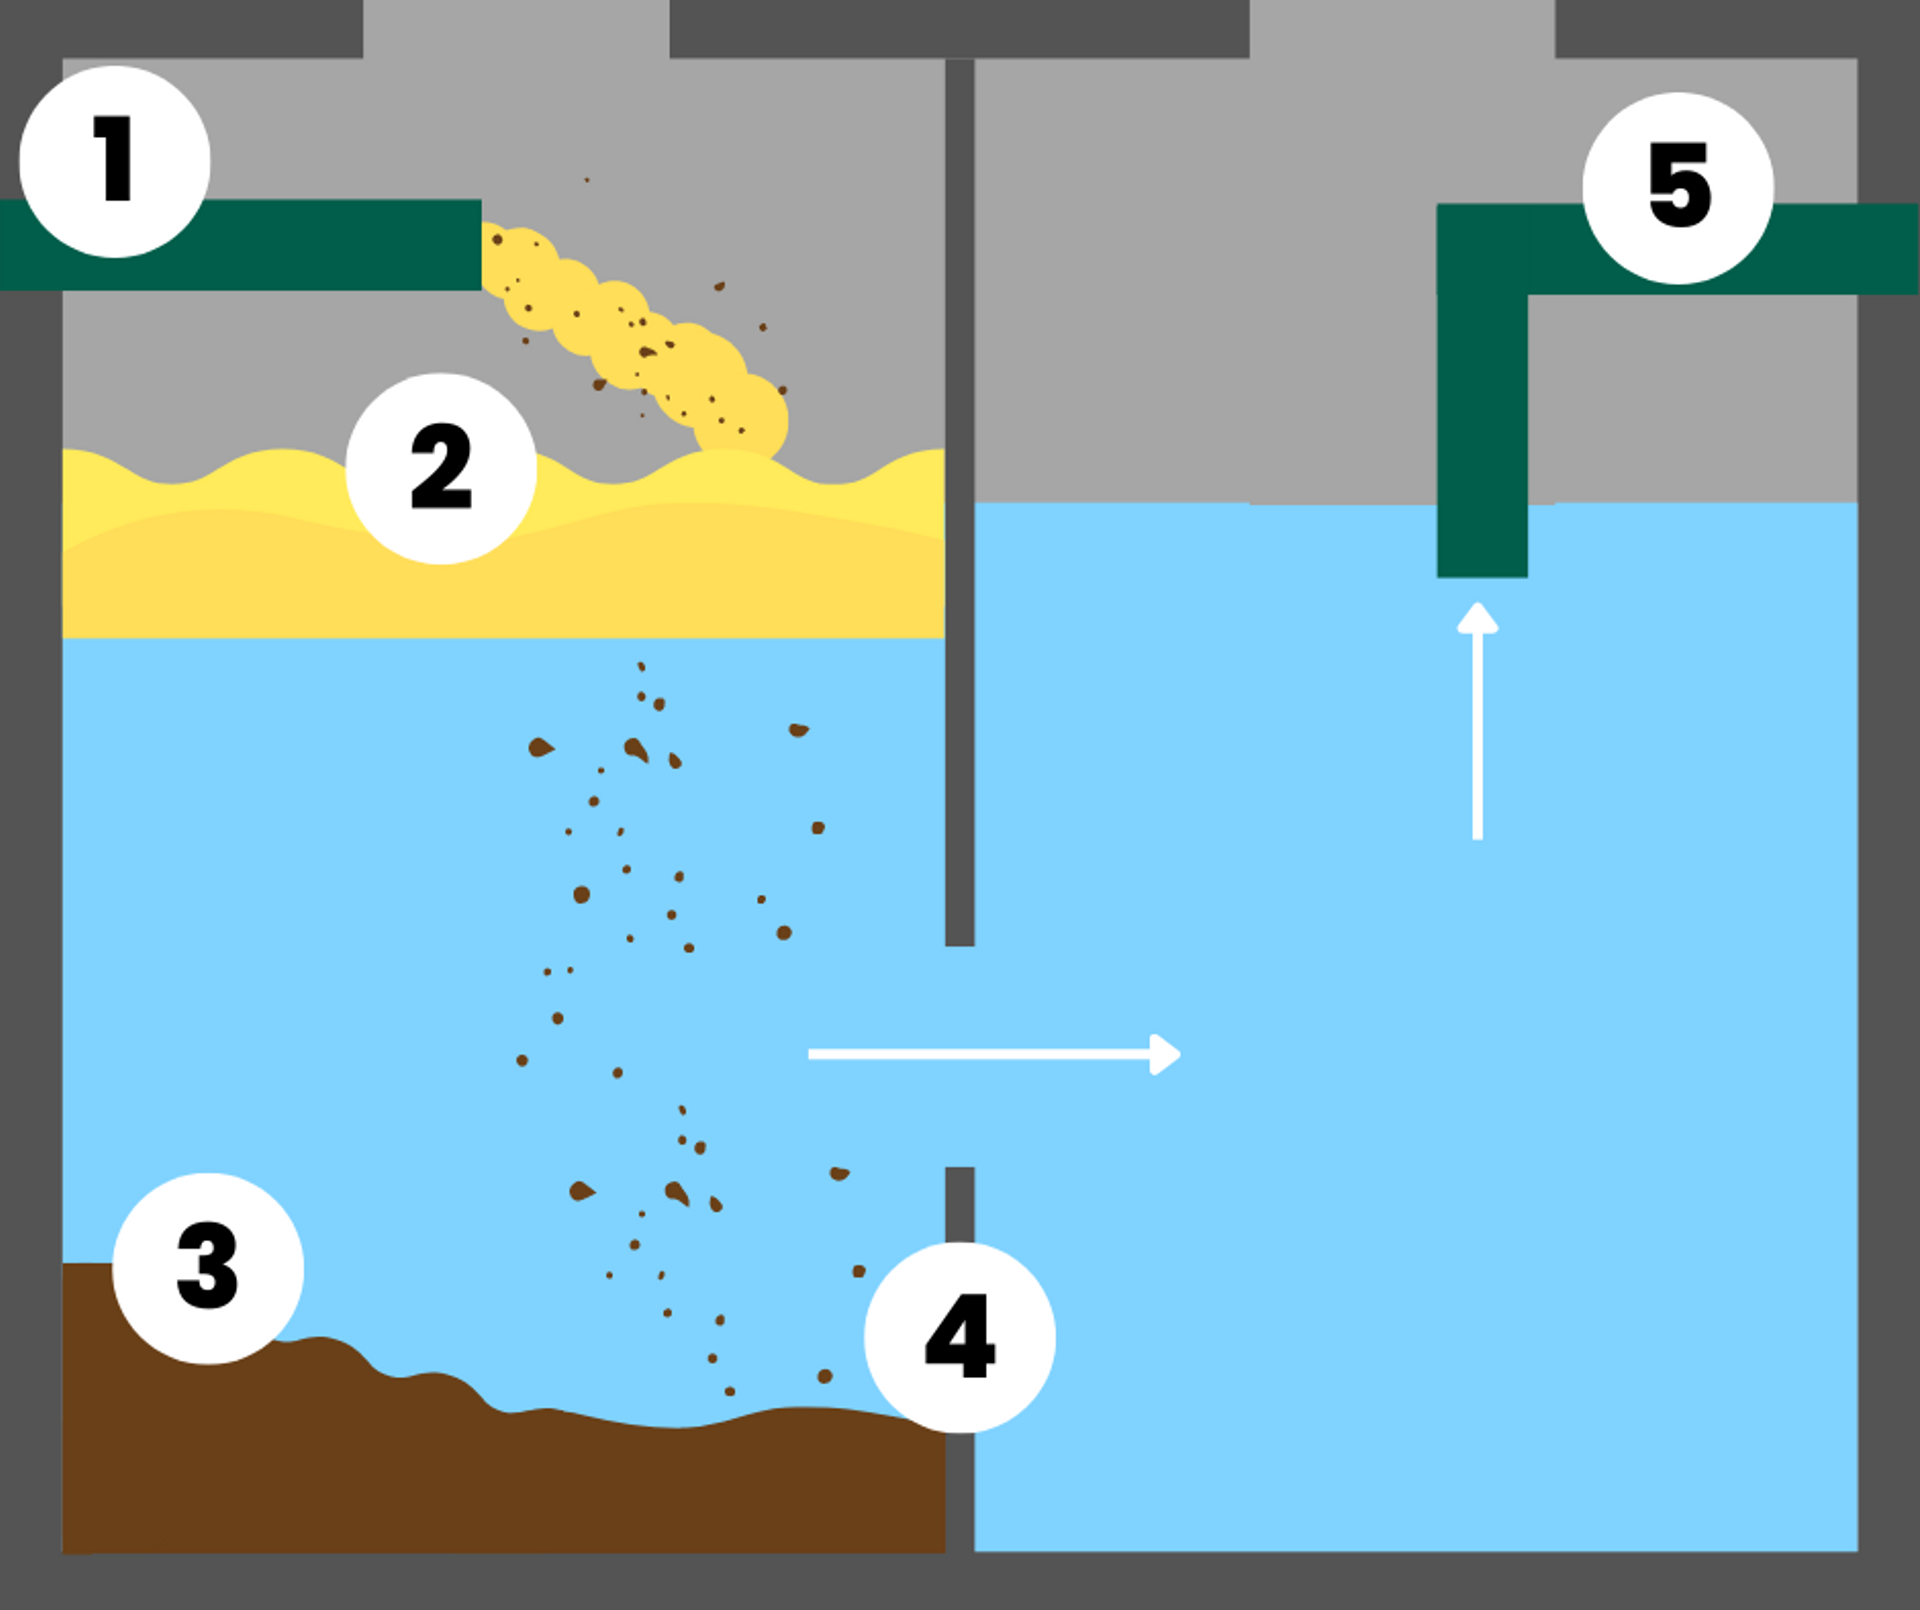
Grease traps come in many different models, sizes, and efficiencies that are dependent on kitchen regulations, size, and laws that vary from state to state. However, all grease traps have the same basic method to ensure FOGs are disposed of properly:
How well a grease trap functions depends on how well it is maintained. These traps can be treated to help them perform to the best of their ability. Continue reading to learn about the importance of grease trap treatments.
The EnviroZyme team performed a grease trap study by experimenting with 2 grease traps. The goal of this experiment was to better analyze field grease trap conditions. Each one started with 13 liters of tap water, 10 grams of ground pinto beans, 10 grams of ground chickpeas, 10 grams of Cream of Wheat, 10 grams of Malt-O-Meal, 6 grams of oatmeal, 5 milliliters of canola oil, 5 milliliters of olive oil, and 5 milliliters of corn oil. Traps were fed with 1 liter of water 5 times daily, 1 milliliter of food solutions once daily, and 1 milliliter of dish soap once daily.
The grease traps were fully aerated and ran for 4 days to allow them to reach equilibrium with each other. Dissolved oxygen (DO) and chemical oxygen demand (COD) were monitored to ensure they reached equilibrium. More specifically, DO was measured to understand bacterial activity in the form of respirometry-decreased DO that comes from an increase in bacterial activity.
5 days later, the team treated one trap with EnviroZyme’s Drain & Grease Trap Treatment product and continued to treat it 5 times daily with 1-gram doses while DO and COD continued to be monitored.
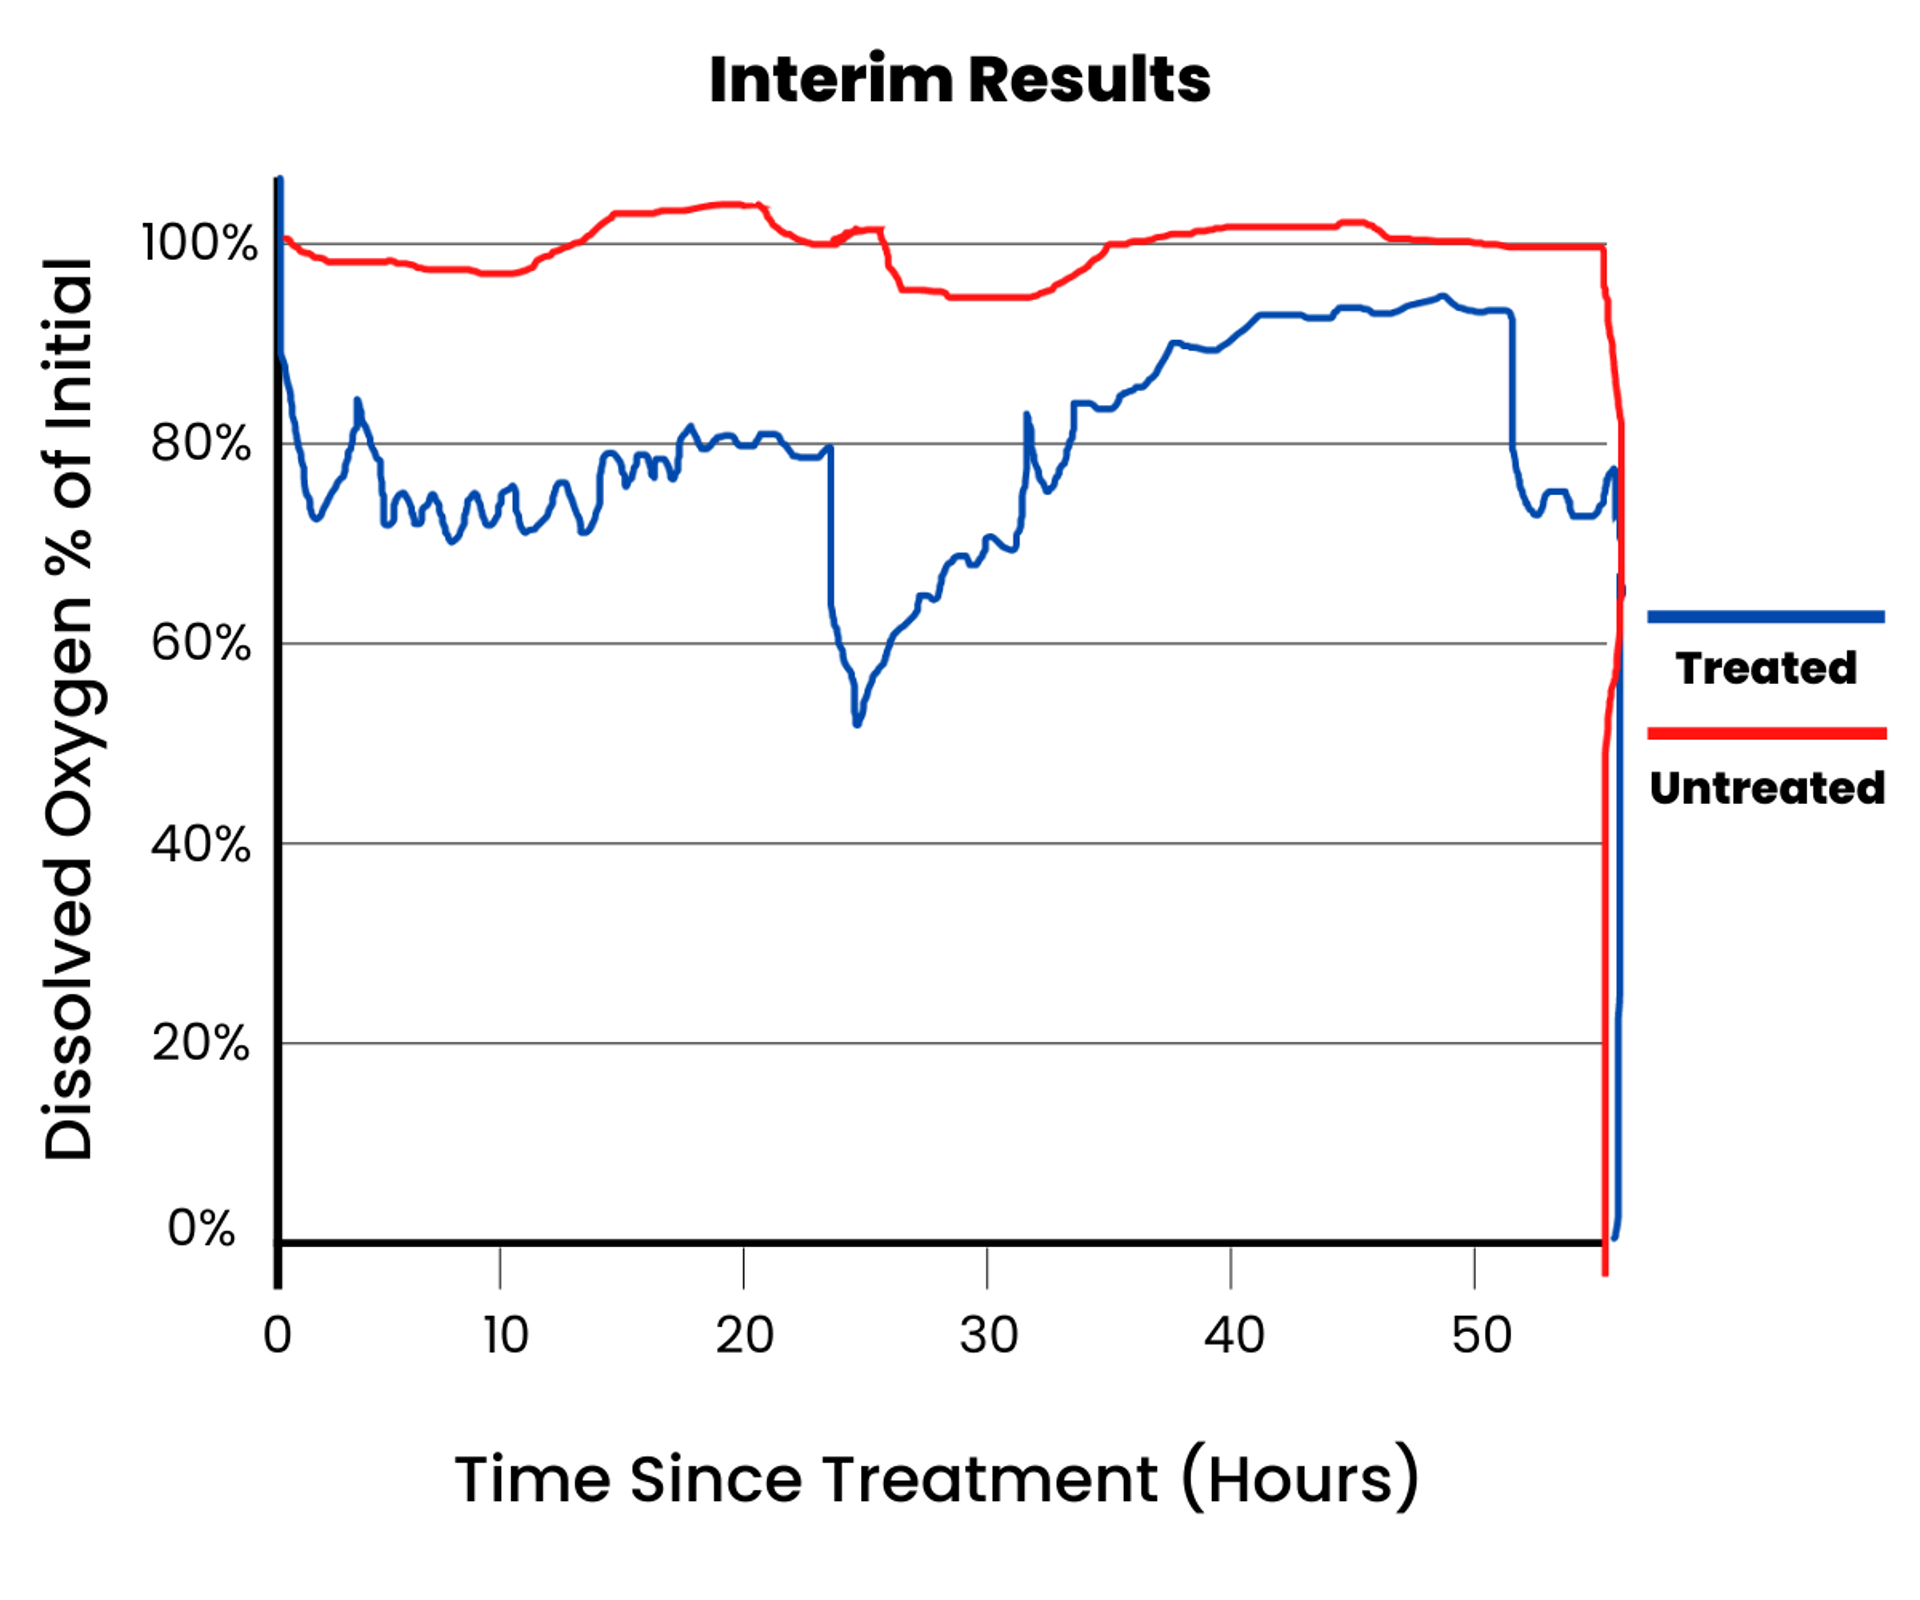
Oxygen levels in the treated trap dropped immediately after Drain & Grease Trap Treatment was added. DO levels stayed below the untreated traps throughout the first 2 and a half days of the experiment, with occasional increases and decreases coming from the addition of water, bacteria, and organic material. 1 week after the experiment started, the aeration in both traps was turned off. Oxygen levels neared zero immediately, and the aeration resumed. DO and COD measurements continued. These interim results confirmed that biological activity causes a decrease of organic material, which can be shown through COD testing. It was also concluded that the addition of dish soap had no negative impact on the results.
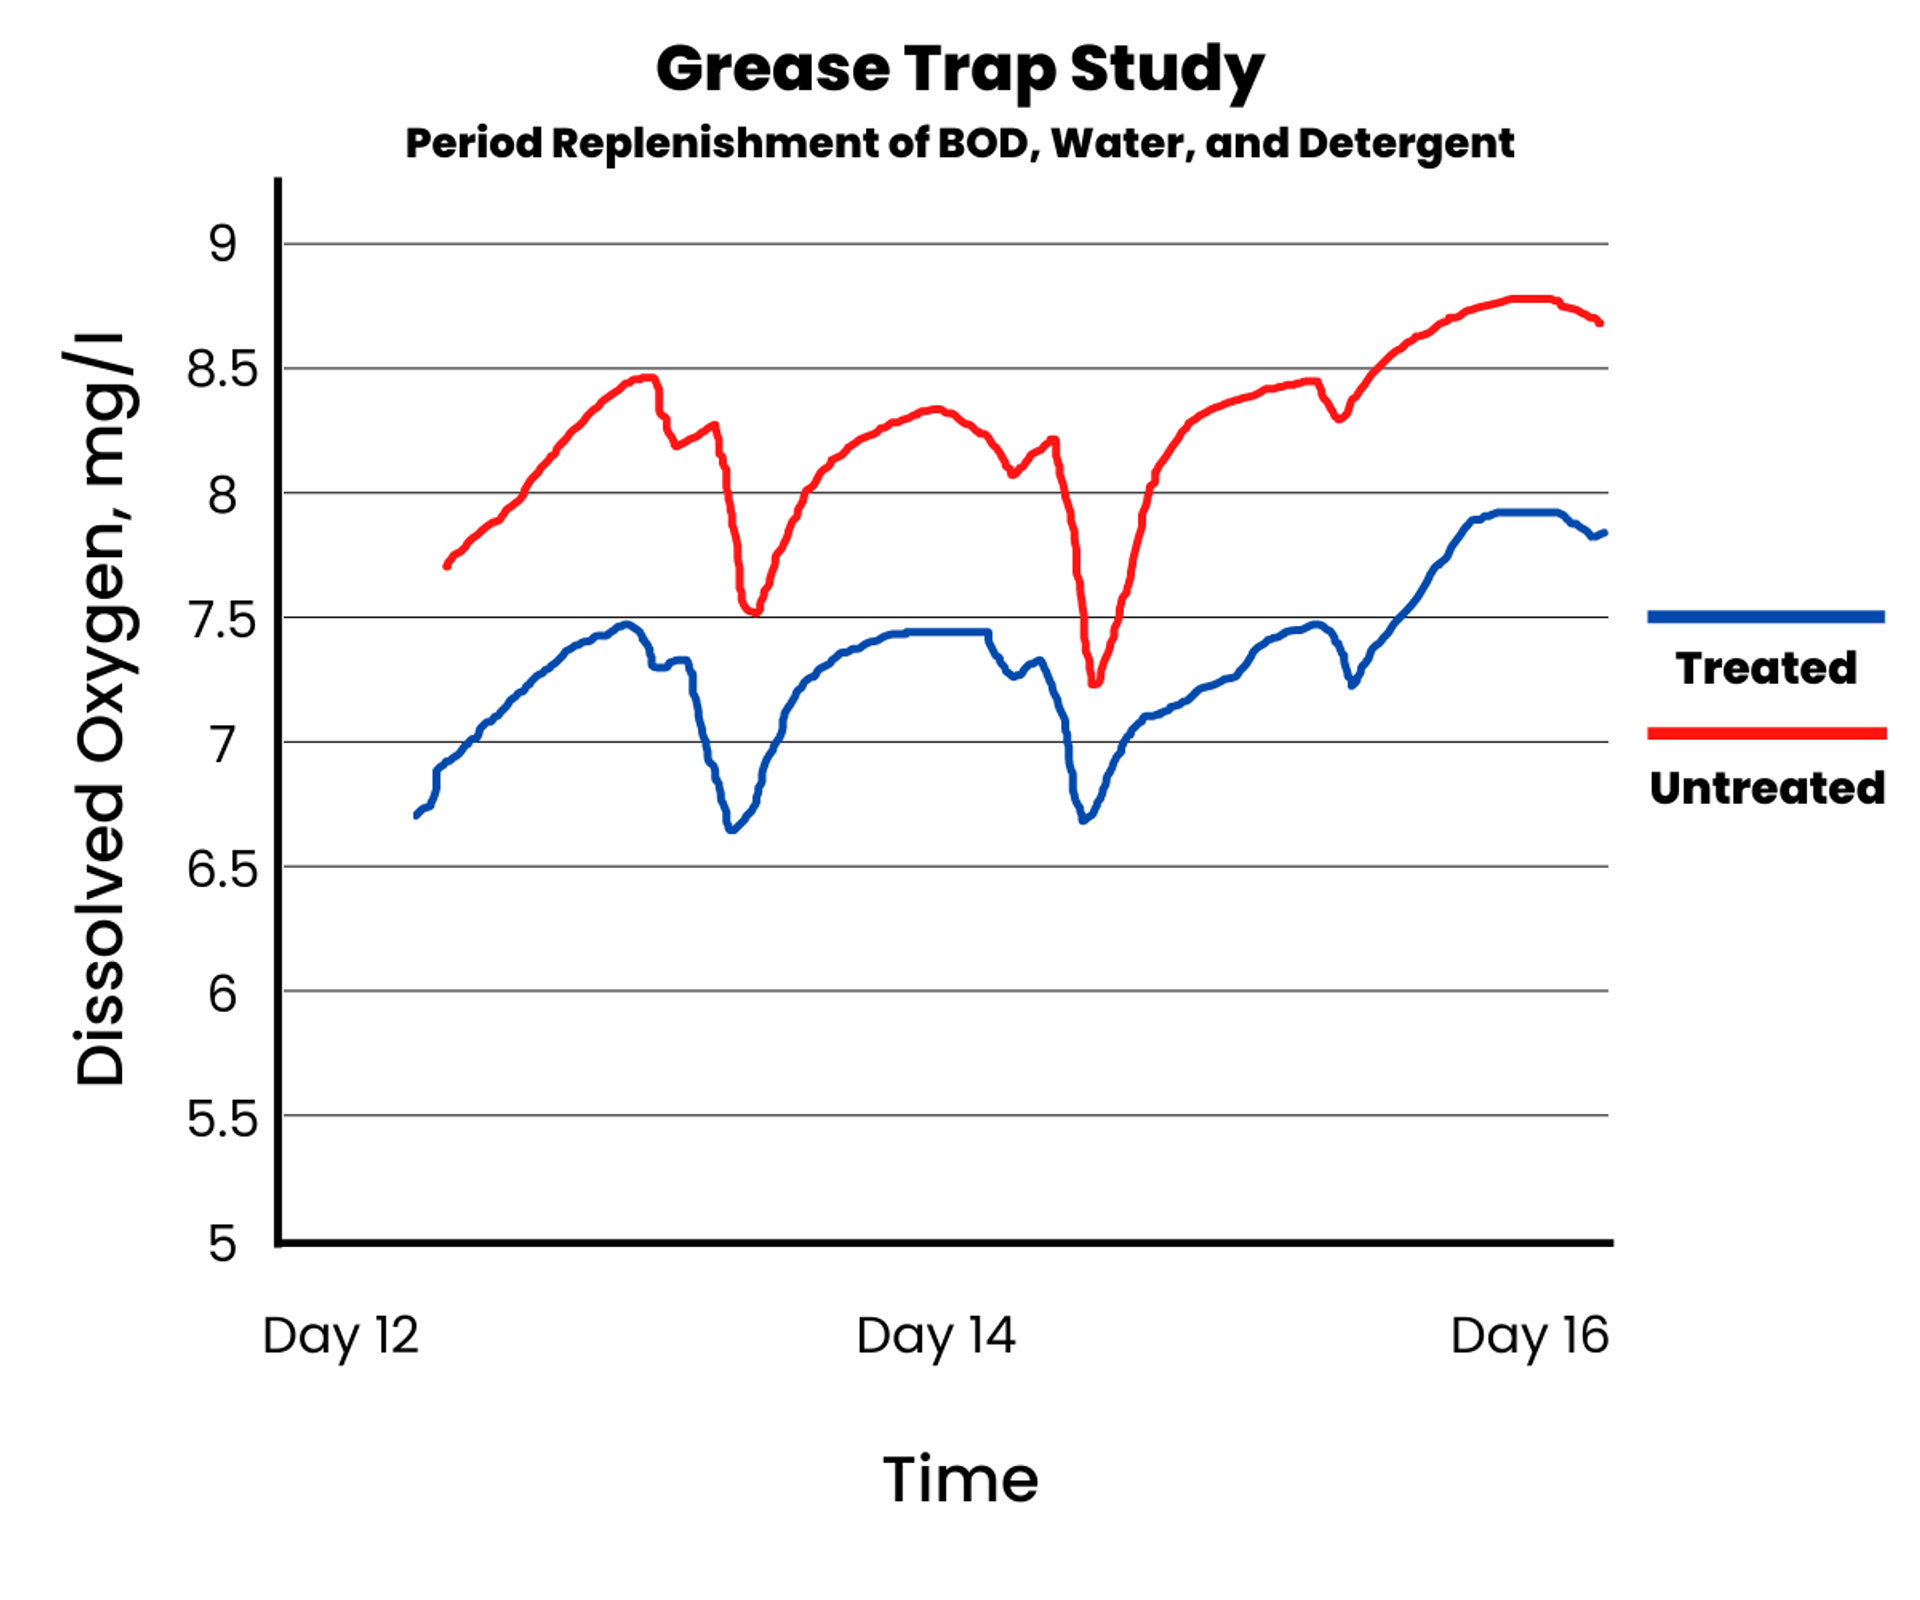
On day 12, the team discontinued all periodic additions and let the grease trap “cook” over 4 days to model grease trap biology over an extended period of non-use, like a holiday or weekend. The results showed several interesting behaviors:
| COD | Day 2 | Day 30 |
|---|---|---|
| Treated | 209 | 284 |
| Untreated | 113 | 741 |
The table above shows the effect of long-term treatment with bacteria. By adding additional organic material every day, there is a slow build-up in COD in the treated tank but at a much more rapid rate in the untreated tank. The organic input and rinse water dilution effects were not balanced out and were not sufficient to rinse or displace the number of organics added every day. This was intentional, so we could force an increase in COD during the experiment.
This balance of organic and freshwater input led to the desired increase in COD in both tanks during the study. The continual addition of organic and partial dilution with water resulted in a much lower COD build in the treated tank, confirming that augmented bacteria from the treatment are consuming organic material faster.